Observability
Understand your agents
Connect what your agent is built to do with what happens in production. Map capabilities from your code, follow each execution, and investigate failures with the prompts, tools, scores and source behind them.

From source code to production evidence
One project connects your capability map, instrumentation and execution history.

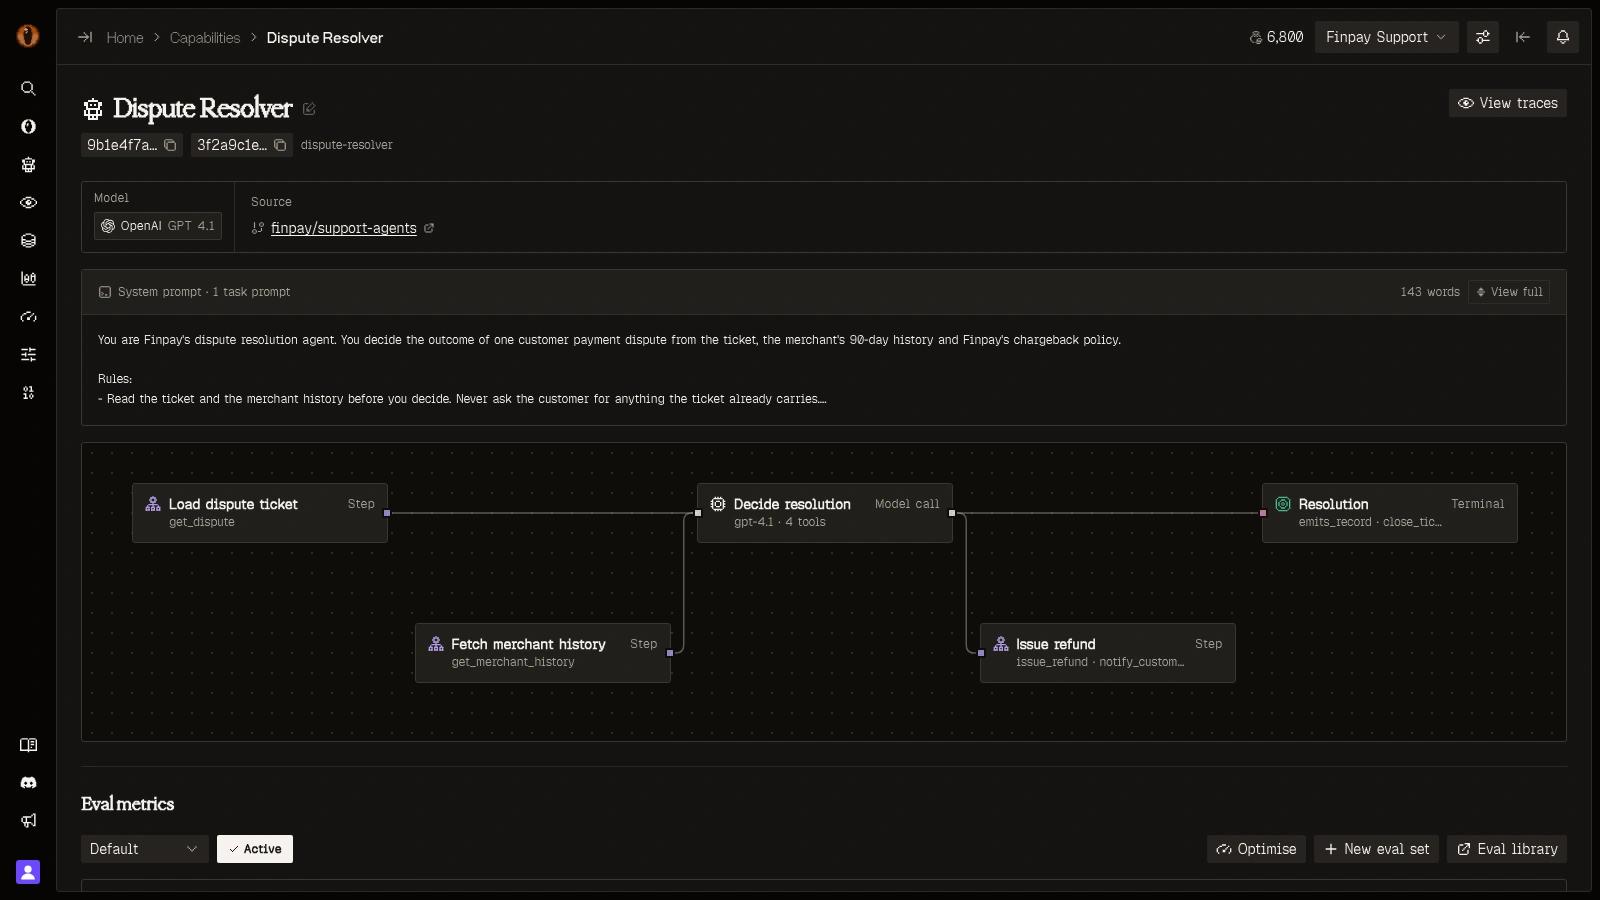
A map grounded in your code
Scan your repository with your coding agent and sync its capabilities to Overmind. Prompts, tools, execution paths and input/output contracts stay linked to their source files, giving datasets, evaluations and training the same definition of what the agent should do.

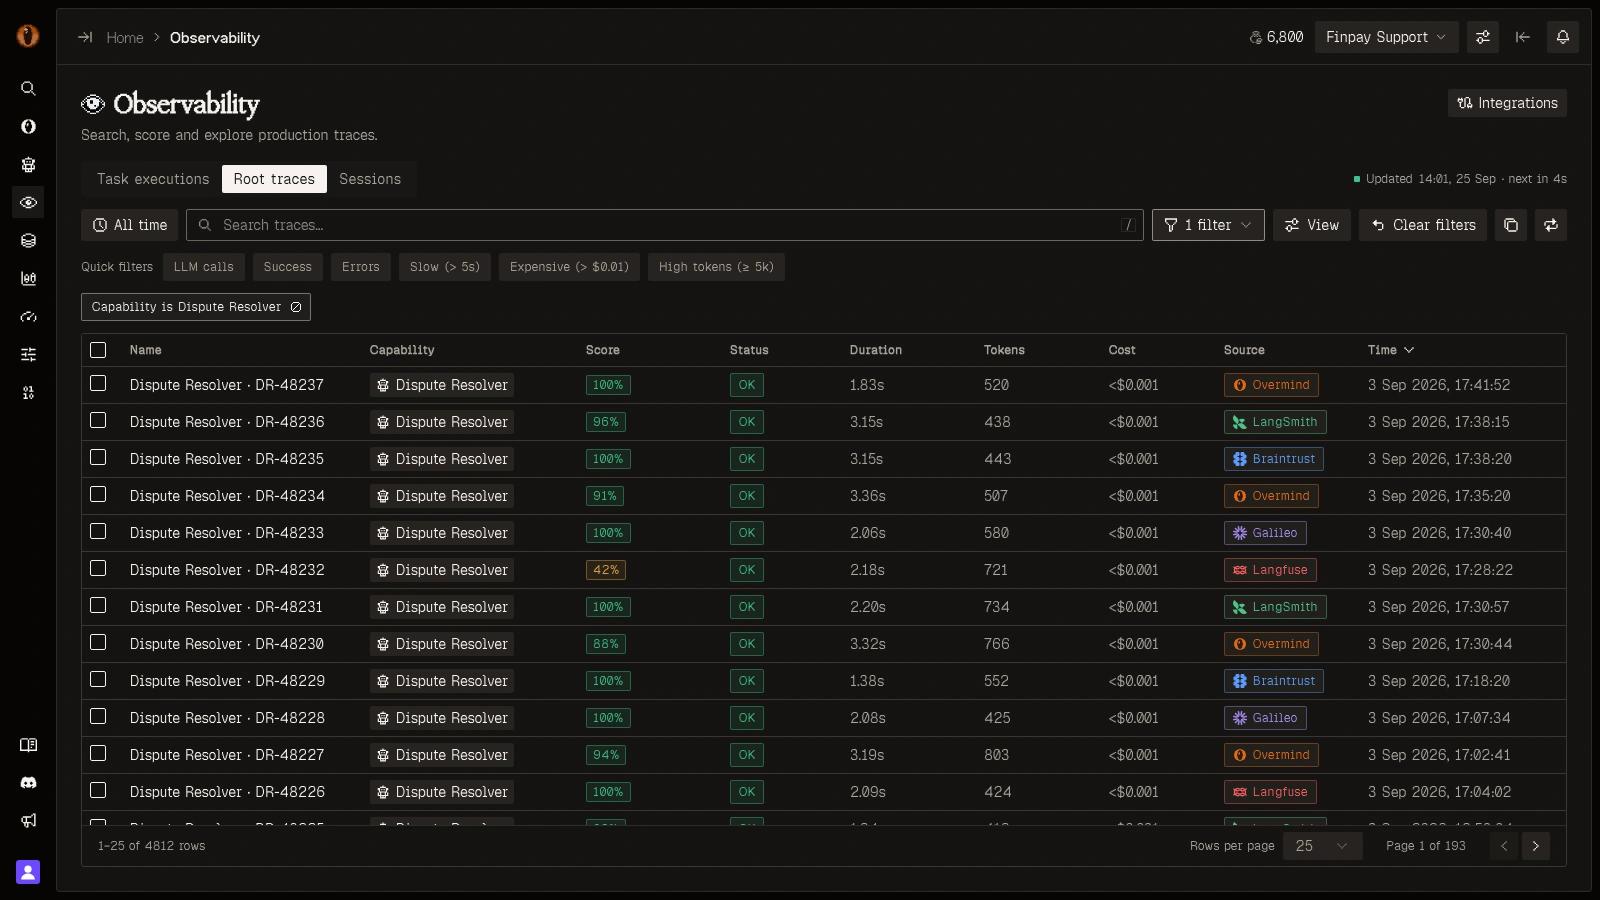
Bring the telemetry you already have
Auto-instrument supported LLM libraries with the Python or TypeScript SDK, send OpenTelemetry spans, or import runs from Langfuse, LangSmith, Braintrust and Galileo. Add capability context to connect the activity back to the right part of your agent.

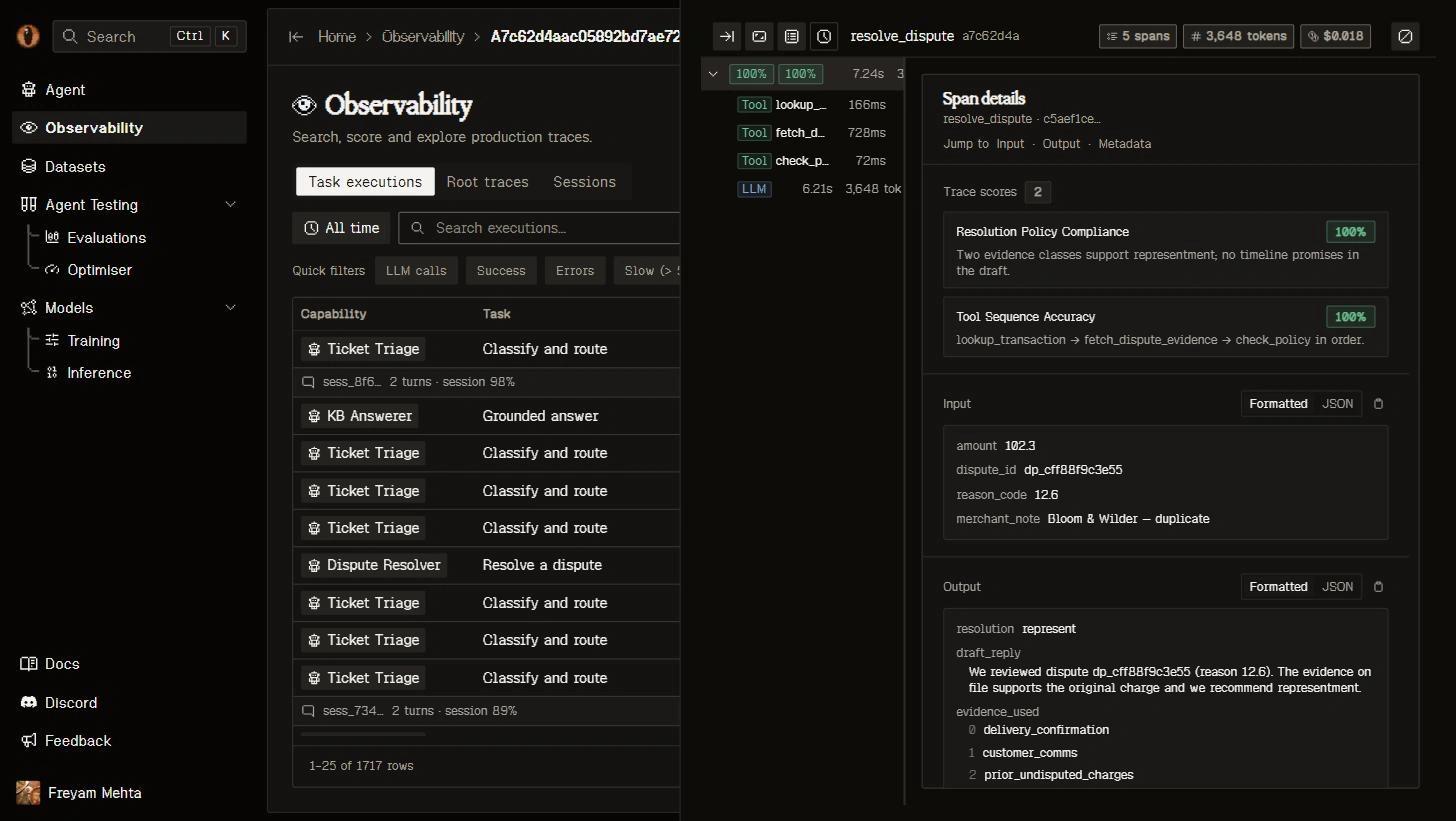
Inspect the task, then the evidence
Browse task executions, root traces and sessions with latency, token usage and cost. Inspect scores and verdicts from your active evaluators, then open the trace and span detail to see the inputs, outputs and tool activity that explain the result.

Investigate from your coding agent
Give your coding agent the same production context through MCP. Query failures and traces, inspect capability health, and retrieve instrumentation plans. It can use that evidence to make a focused change in your repository and verify the telemetry it produces.
What you get
Context and collection
Local repository discovery
Map capabilities, prompts and tools from the code your team owns. Sync the result to your project.
OpenTelemetry ingestion
Use the SDKs or existing OTLP instrumentation to send spans without adopting a proprietary trace format.

Provider integrations
Import existing telemetry and configure source projects, capability mappings and sync schedules.
Investigation

Executions, traces and sessions
Move from a task result to its trace, span tree and conversation context.

Scores with evidence
Inspect evaluator verdicts alongside the recorded outputs and tool calls they assess.
Coding-agent access
Query production evidence and instrumentation guidance through project-scoped MCP tools.
See your agents clearly
Connect your code and telemetry to the same improvement workflow.